quollr, showing how early ideas evolved into a diagnostic R package.
In addition to the completed methods and software presented in this thesis, a large amount of exploratory planning and design work went into the development of the R packages quollr (Figure C.1) and cardinalR (Figure C.2), as well as the Shiny application menuraR (Figure C.3). This includes personal working sheets, sketches, and early conceptual diagrams that show how initial ideas gradually evolved into the implemented software tools.
quollr, showing how early ideas evolved into a diagnostic R package.
cardinalR, documenting the evolution of data generation strategies into software.
menuraR, showing how initial concepts were refined into a functional Shiny application.
Each software name is inspired by an animal. quollr is named after the quoll, a carnivorous, curious, and endangered marsupial from Australia. cardinalR is inspired by the North American cardinal bird. menuraR comes from Australia’s lyrebirds (Menura), famous for their elaborate courtship displays and extraordinary ability to mimic sounds.
I presented my research work at 12^{th}-Conference of the Asian Regional Section of the International Association for Statistical Computing (IASC-ARS 2023) (Wollongon, Australia), Australian Statistical Conference (ASC 2023) (Wollongon, Australia), Bioinformatics Seminar 2024, Victorian branch of the Australian and New Zealand Industrial and Applied Mathematics Society (VicANZIAM) 2024 (RMIT university, Melbourne, Australia), Faculty of BusEco Three Minute Thesis (3MT) competition 2024, useR! 2024 (Salzburg, Austria), Graphics Group Presentation 2024 (Nebraska, USA), UNO Data Science Club 2024 (Omaha, USA), Joint Statistical Meetings (JSM) 2025 (Nashville, USA), useR! 2025 (Durham, USA), Biometrics in the Bush Capital (BIBC2025) (Canberra, Australia), and Australian Statistical Conference (ASC 2025) (Perth, Western Australia) (Figure C.6).
In July 2024, I had the privilege of visiting A/Prof Ursula Laa at the University of Natural Resources and Life Sciences, Vienna (BOKU University), accompanied by Prof Di Cook, Prof Eun-Kyung Lee, and Dr Natalia da Silva. During this visit, I engaged with academic staff, students, and fellow visitors at BOKU University, gaining valuable insights into their research and receiving constructive feedback on my work and its potential contributions to ongoing projects (Figure C.6 Vienna).
From late October to late December 2024, I visited Prof Heike Hofmann, A/Prof Susan VanderPlas, and Dr Michelle Graham at the University of Nebraska, Lincoln, USA (UNL) (Figure C.6 Nebraska). During this time, I presented my research on high-dimensional data visualization and dimension reduction techniques, participated in the Nebraska R User Group meetings, and joined discussions with the Graphics Group, which provided rich opportunities for collaboration and learning.
These visits were invaluable for broadening my perspective, fostering meaningful exchanges with experts, and deepening my understanding of dynamic visualization and multivariate data analysis. I also explored several resources that informed my work, including research on dynamic tours for high-dimensional data, parallel coordinate plots, perceptual accuracy in visualizations, and interactive visualization tools such as langevitour and tourr.
During my PhD, I contributed to the academic and statistical communities through service, leadership, and outreach, supporting inclusive research and knowledge exchange. My roles include NUMBATs Seminar Organizer (Monash University, 2025), Session Chair at useR! 2024 (Salzburg) and ASC 2023 (Wollongong), Tutorial Helper for WOMBATs Tutorials (Monash University, 2022), and organizer for R-Ladies Melbourne (2023). These activities let me connect with diverse audiences, support early-career researchers, and share ideas about stats and computational methods.
I have been part of delivering and preparing materials for workshops on Reproducible Reporting and Research with Quarto (September 2025) and Reproducible Reporting, Academic Papers, Presentations, and Theses with Quarto (July 2025), contributing to hands-on training for researchers on reproducible practices and effective research communication (Figure C.4).
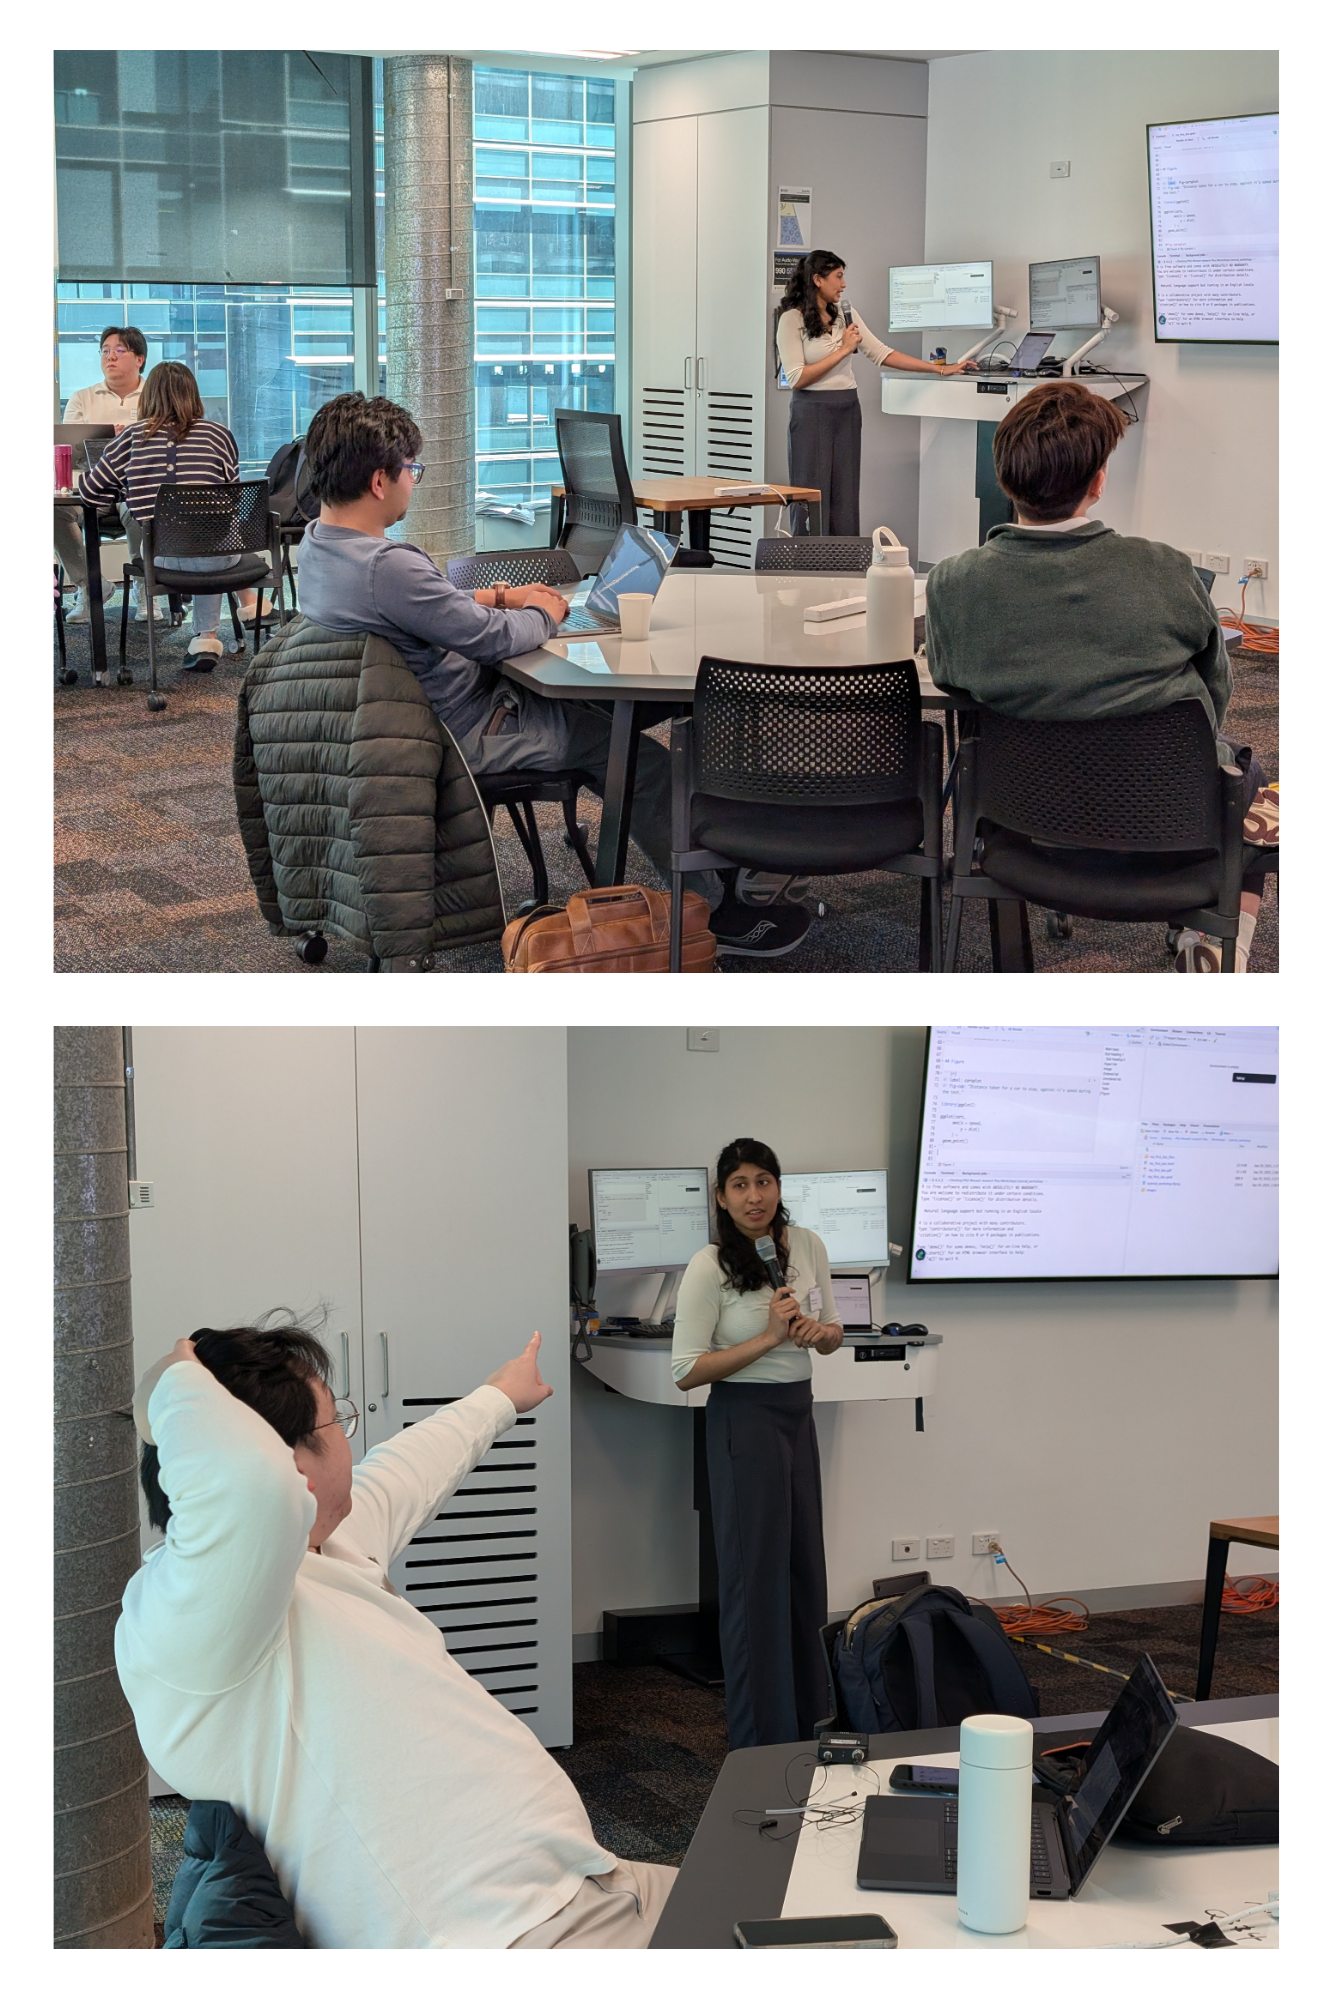
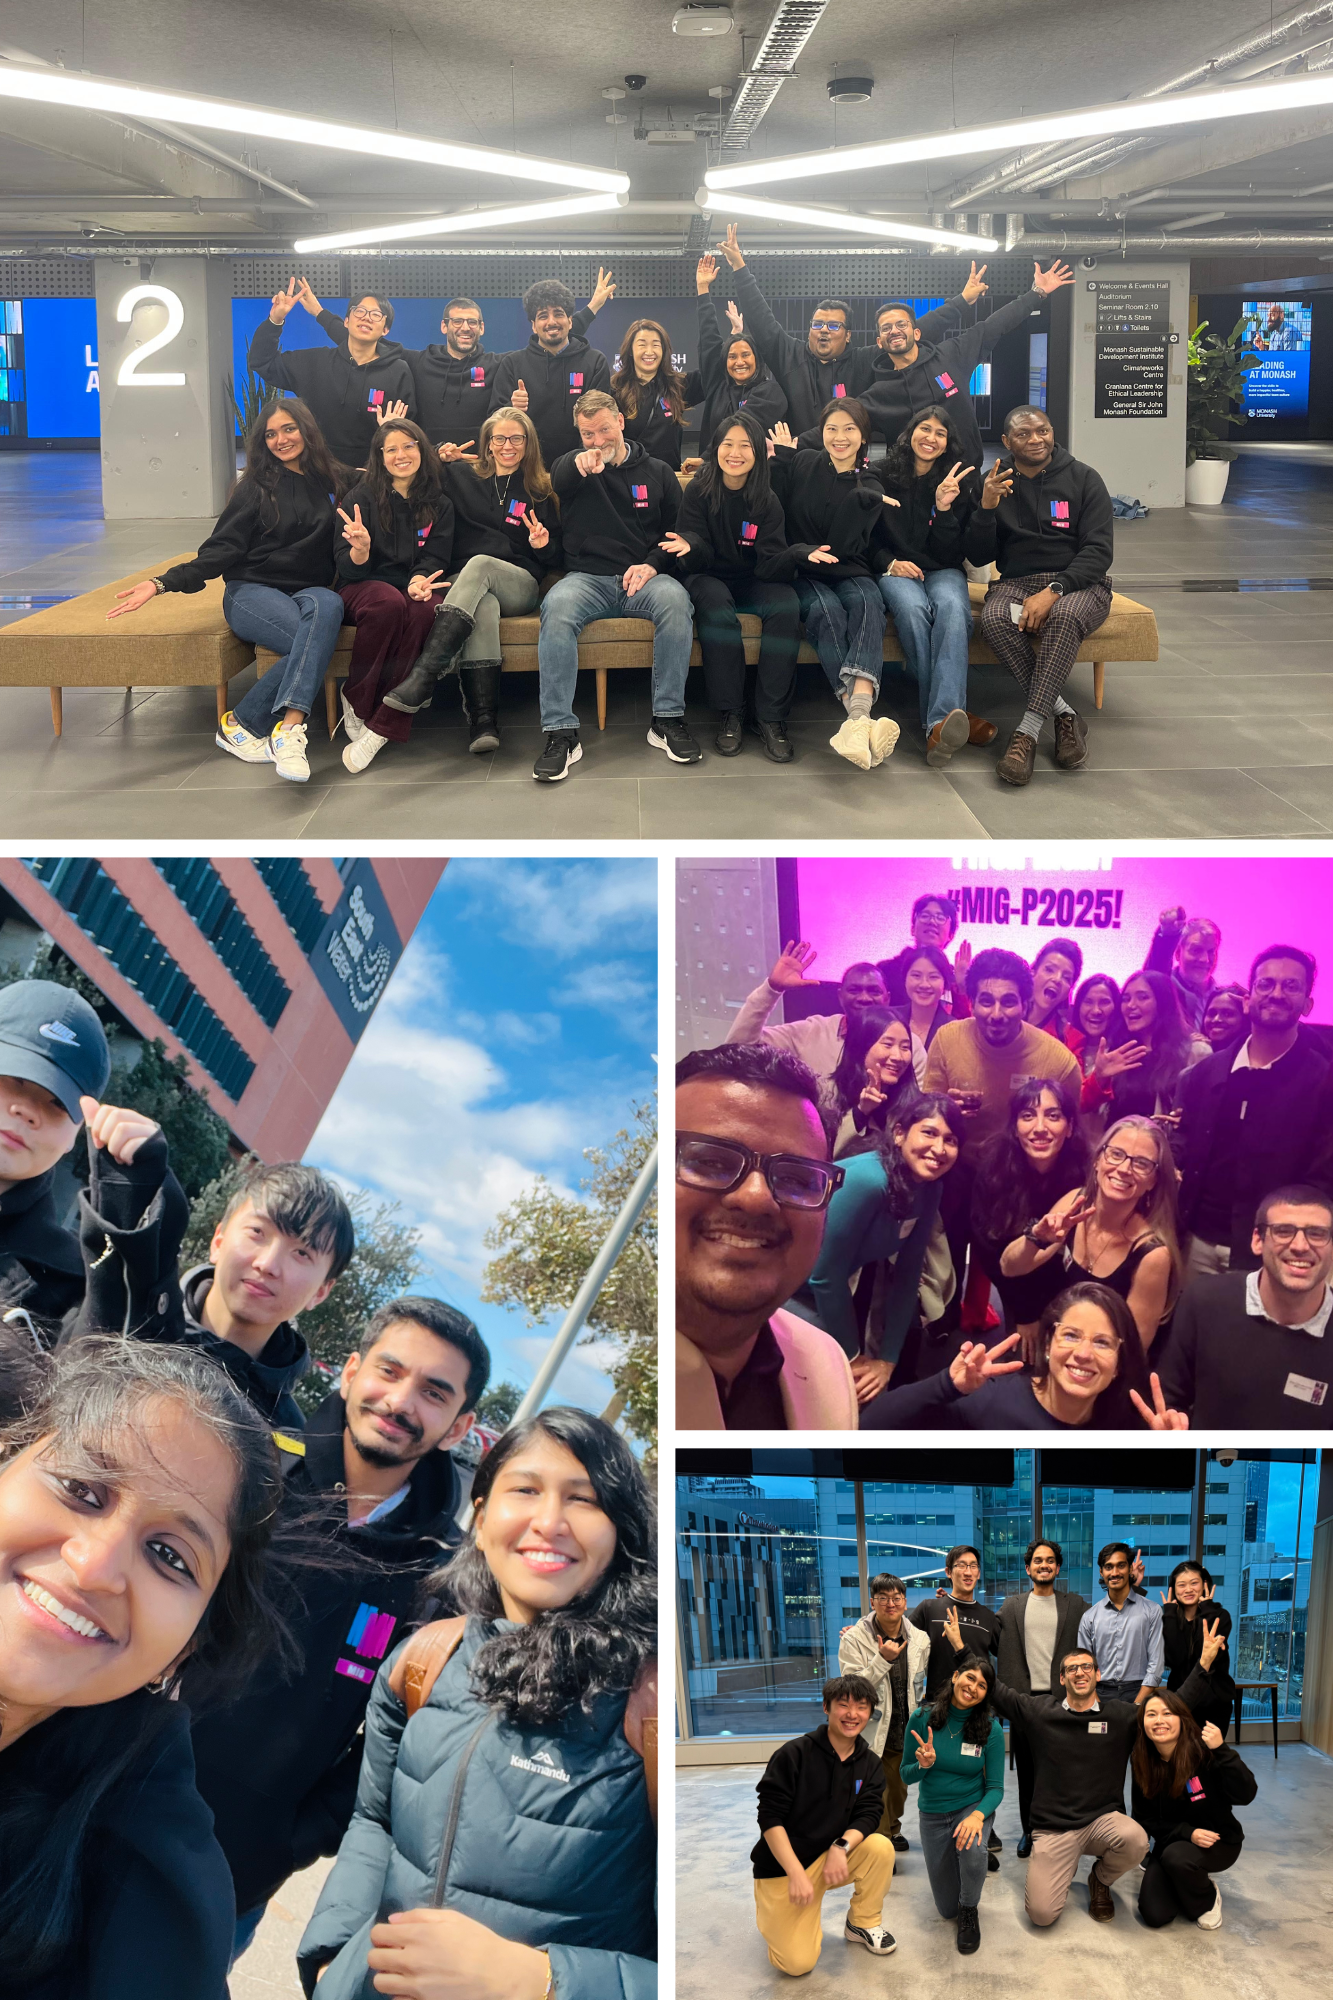
In July 2025, I had the privilege of serving as a coach in the Monash Innovation Guarantee Postgraduate (MIG-P) program (Figure C.5). Over three inspiring weeks, I worked with a diverse cohort of master’s students as they tackled real-world, industry-defined challenges. It was an incredible experience to support their journey from exploration and ideation through to prototyping and pitching—witnessing their creativity, resilience, and ability to thrive in ambiguity.
I contributed to open-source software development by co-supervising the creation of the polarisR package (Yadav et al. 2025) during a Google Summer of Code project with Dr. Ursula Laa and Prof. Eun-Kyung Lee, whom I met during my visit to the University of Natural Resources and Life Sciences in Vienna, Austria. polarisR is a Shiny application for diagnosing 2\text{-}D NLDR layouts using the quollr implementation. It also supports comparing how the data appear in high dimensions through various tour methods, including scatter, sage, and slice.
I have contributed to teaching a range of undergraduate and postgraduate courses in statistics, data analysis, and machine learning. These include Statistical Thinking ([ETC5242], 2025; [ETC2420], 2025), Introduction to Data Analysis ([ETC5510], 2024; [ETC1010], 2024), Introduction to Machine Learning ([ETC3250], 2023–2024; [ETC5250], 2023–2025), and Exploratory Data Analysis ([ETC5521], 2023).
This journey has been as much about exploring the unknown as it has been about developing resilience and insight along the way. I am deeply grateful for the people, places, and lessons that have shaped both this work and the path forward.