cardinalR and quollr packages.
All materials associated with this thesis are openly available for transparency and following reproducible practice. The thesis is written in Quarto (Allaire and Dervieux 2024) and is available in both HTML and PDF formats. The HTML formatted thesis, which includes interactive and linked plots can be read at https://jayani-lakshika-phd-thesis.netlify.app, and the PDF formatted thesis can be downloaded from https://github.com/JayaniLakshika/Monash_PhD_thesis/blob/main/_book/New-Interactive-Visual-Tools-and-Statistical-Methodology-for-Selecting-and-Evaluating-Non-linear-Dimension-Reduction-Layouts-of-High-Dimensional-Data.pdf. All source code, data, and software used to generate the thesis is available on the public GitHub repository at https://github.com/JayaniLakshika/Monash_PhD_thesis.
To support accessibility, all figures are supplemented with alt text, which allows screen readers and vision-impaired readers to access their content. The autoAlt (Maliny Po 2025) package was used as a starting point for generating these descriptions, which were then reviewed and refined to better reflect the content of each figure and its caption.
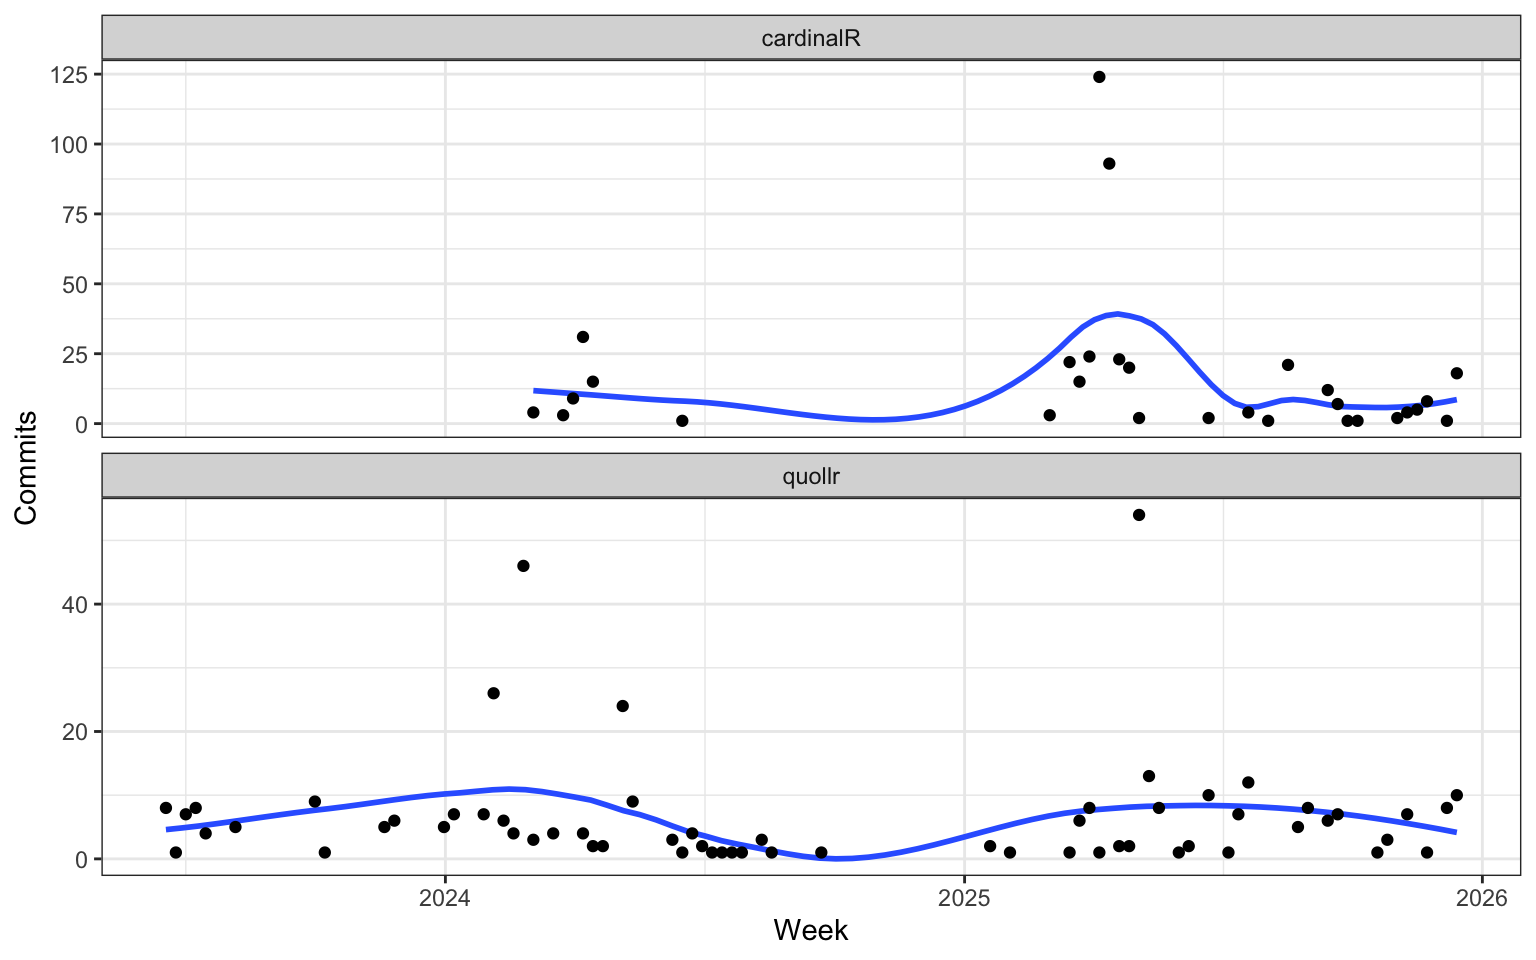
Some of the software developed has been packaged and is been available on the Comprehensive R Archive Network (CRAN). The R package quollr, introduced and used in Chapter 2 and Chapter 3, has been on CRAN since March 2024 and has received 5181 downloads from the CRAN mirror as of 14^{th} January 2026; its development version is hosted on GitHub at https://github.com/jayanilakshika/quollr. The R package cardinalR, discussed in Chapter 4, has been available on CRAN since April 2024 and has received 4416 downloads from the CRAN mirror as of 14^{th} January 2026, with the latest development version at https://github.com/jayanilakshika/cardinalR. Figure 8.1 gives an overview of my Git commits to these repositories.
cardinalR and quollr packages.
A Shiny application described in Chapter 6, is accessible via one of the mirror sites at https://menurar.netlify.app/, with its source code available at https://github.com/JayaniLakshika/menuraR. The survey web application, Match-a-roo (https://ebsmonash.shinyapps.io/Match-a-roo/), was designed and implemented in Shiny to collect the data for the experiment discussed in Chapter 5, participant responses, and demographic information. Each subject accessed the survey through the shinyapps.io (RStudio, PBC n.d.) server.
In addition, a number of R and Python packages were essential in the development of this work, including tidyverse (Wickham et al. 2019), ggbeeswarm (Clarke et al. 2023), ggrepel (Slowikowski 2024), GGally (Schloerke et al. 2025), colorspace (Zeileis et al. 2020), scales (Wickham et al. 2025), patchwork (Pedersen 2024), plotly (Sievert 2020), crosstalk (Cheng and Sievert 2025), htmltools (Cheng et al. 2024), quollr (Gamage et al. 2025a), cardinalR (Gamage et al. 2025b), detourr (Hart and Wang 2025), geozoo (Schloerke 2016), knitr (Xie 2015), kableExtra (Zhu 2024), lme4 (Bates et al. 2015), broom.mixed (Bolker and Robinson 2024), emmeans (Lenth 2025), mclust (Scrucca et al. 2023), fpc (Hennig 2024), binom (Dorai-Raj 2022), conflicted (Wickham 2023), ggforce (Pedersen 2025), here (Müller 2025), grid (R Core Team 2025), gridExtra (Auguie 2017), png (Urbanek 2022), gtools (Warnes et al. 2023), stats (R Core Team 2025), mvtnorm (Genz and Bretz 2009), MASS (Venables and Ripley 2002), scikit-learn (Pedregosa et al. 2011), Rtsne (Krijthe 2015), uwot (Melville 2025), phateR (Moon et al. 2019), pacmap (Wang et al. 2021), trimap (Amid and Warmuth 2022), and reticulate (Ushey et al. 2025).
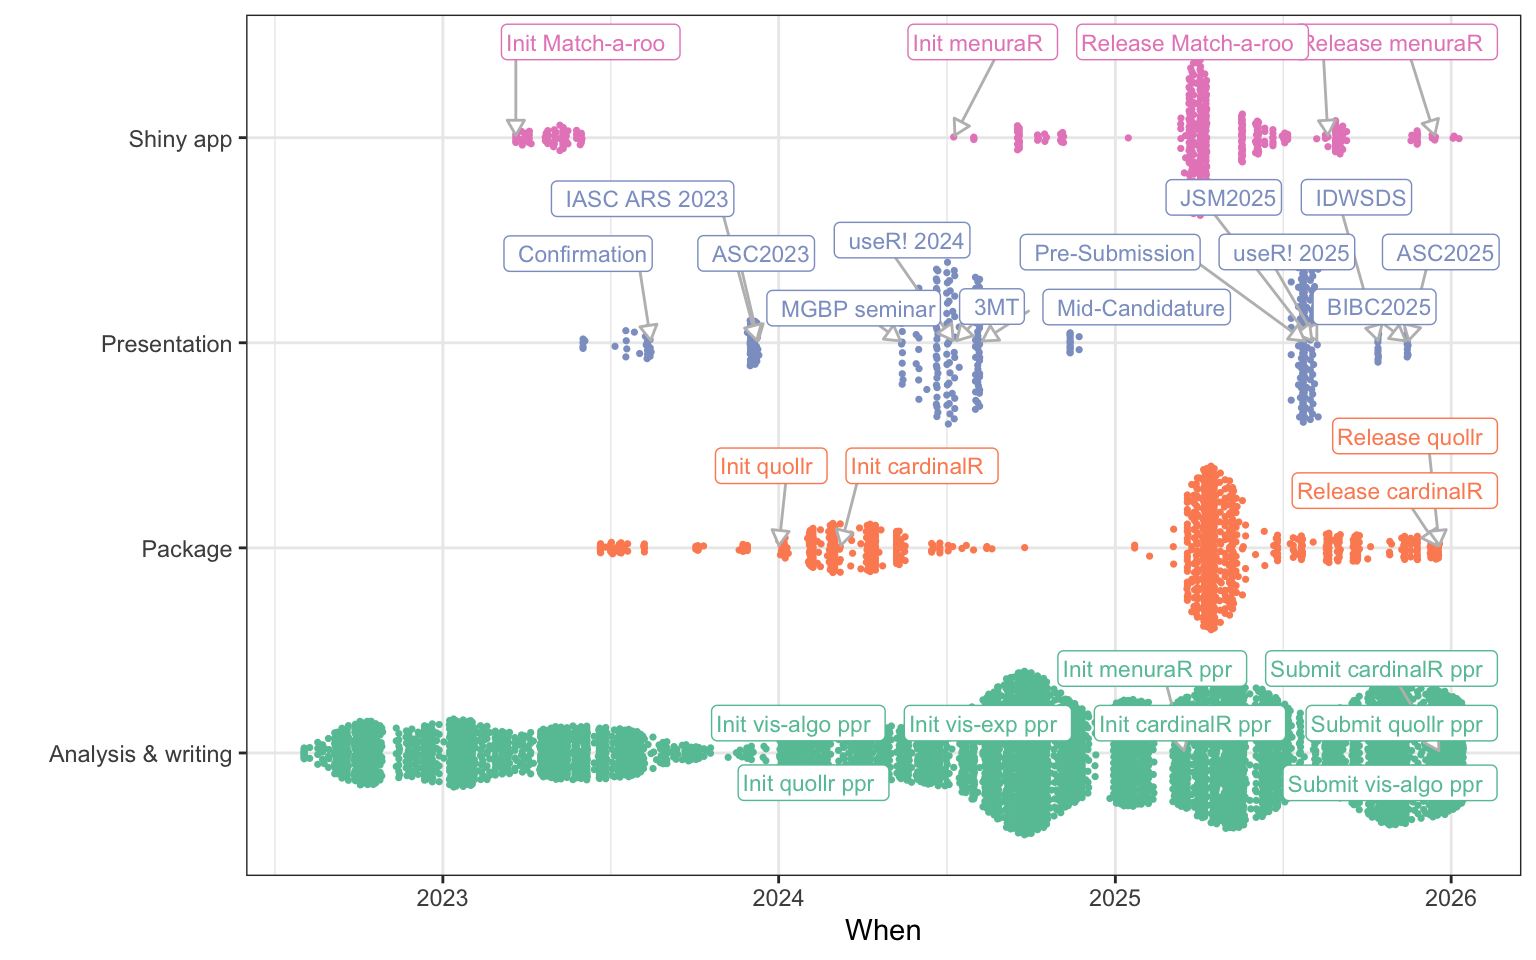
Presentations, package development, and writing are the three primary types of activities that shape this thesis. Figure 8.2 summarizes my GitHub commits documenting these activities since the start of my PhD, with commits grouped by activity type and annotated with important milestones. It has been a fruitful program.