7 Conclusion and Future Plans
7.1 Contributions
The primary contributions of this research are fivefold. We introduced a novel method for visualizing how NLDR warps data, thereby improving the diagnostics of NLDR techniques. This methodology is available on an R package, quollr, which implements the proposed diagnostic method. The cardinalR package generates high-dimensional clustering data with a variety of cluster shapes and enhanced features, such as added noise and background noise. A human subjects experiment showed that different methods create a systematically different conceptualization of the same cluster structure from each other and from what would be imagined from tour views. Finally, this methodology has been made available in a user-friendly web interface. Overall, this work supports better exploratory data analysis and visualization of high-dimensional data.
7.2 How the chapters fit together
In the Introduction, we showed a published UMAP layout of a human PBMC CITE-seq dataset (Hao et al. 2021) (Figure 1.1) as a motivating example. This layout shows multiple clusters with distinct shapes: some appear compact and well-separated, while others are elongated, curved, or partially overlapping. In total, six clusters can be observed, including three with nonlinear shapes, two roughly Gaussian clusters, and one elliptical cluster, along with a small amount of background noise. We asked the question: Does it faithfully represent the structure of the underlying 10\text{-}D PBMC CITE-seq data? Here is how we can check that given the various contributions of this thesis.
Figure 7.1 shows the data using the tour. It also suggests that there are six clusters, and they are fairly close to one another, with three nonlinear-shaped clusters, two Gaussian-like blobs, and one closer to an ellipse, alongside some scattered background points. The full dataset contains approximately 160,000 observations, so for computational efficiency for visualization purposes, we display a random subset of 10,000 points. Such cluster arrangements are commonly seen in other bioinformatics data.
Using the quollr framework, we evaluated how well the UMAP layout reflects the structure of the 10\text{-}D PBMC CITE-seq data (Figure 7.2). With a model fitted using a binwidth of 0.03, the layout appears reasonable overall, but some limitations become clear. In particular, the roughly Gaussian clusters look more squeezed than expected, and background noise seems to form a separate cluster that likely does not represent a true group in the data. In addition, the nonlinear shaped clusters could benefit from being more spread out to better reflect their underlying structure. Also, clusters should be closer. These observations suggest that, while the current layout is informative, there is good potential to find an alternative layout that represents the data structure even more clearly.
This motivates the comparison of multiple NLDR layouts, rather than relying on a single embedding. The Shiny app menuraR makes this comparison easier by allowing different layouts and parameter settings.
Rather than computing embeddings on the fly, it is also helpful to precompute the NLDR layouts. In this case, four layouts are of interest:
- the published UMAP layout (n-neighbors = 30, min_dist = 0.3),
- a tSNE layout (perplexity = 84),
- a TriMAP layout (n-inliers = 12, n-outliers = 4, n-random = 3), and
- a PaCMAP layout (n-neighbors = 10, init = random, MN-ratio = 0.5, FP-ratio = 2).
These layouts can be saved as a single CSV file, following menuraR’s naming conventions (emb1, emb2, or prefixed versions for multiple layouts), along with a small metadata file describing the method and hyper-parameters used. Uploading precomputed layouts avoids long computation times and makes it easy to focus on comparison rather than setup.
Once the data and layouts are loaded in the Data Upload tab, all three embeddings appear in the “Your Loaded NLDR Layouts” panel (Figure 7.3). From there, they can be selected together and passed into the Compare NLDR Layouts tab.
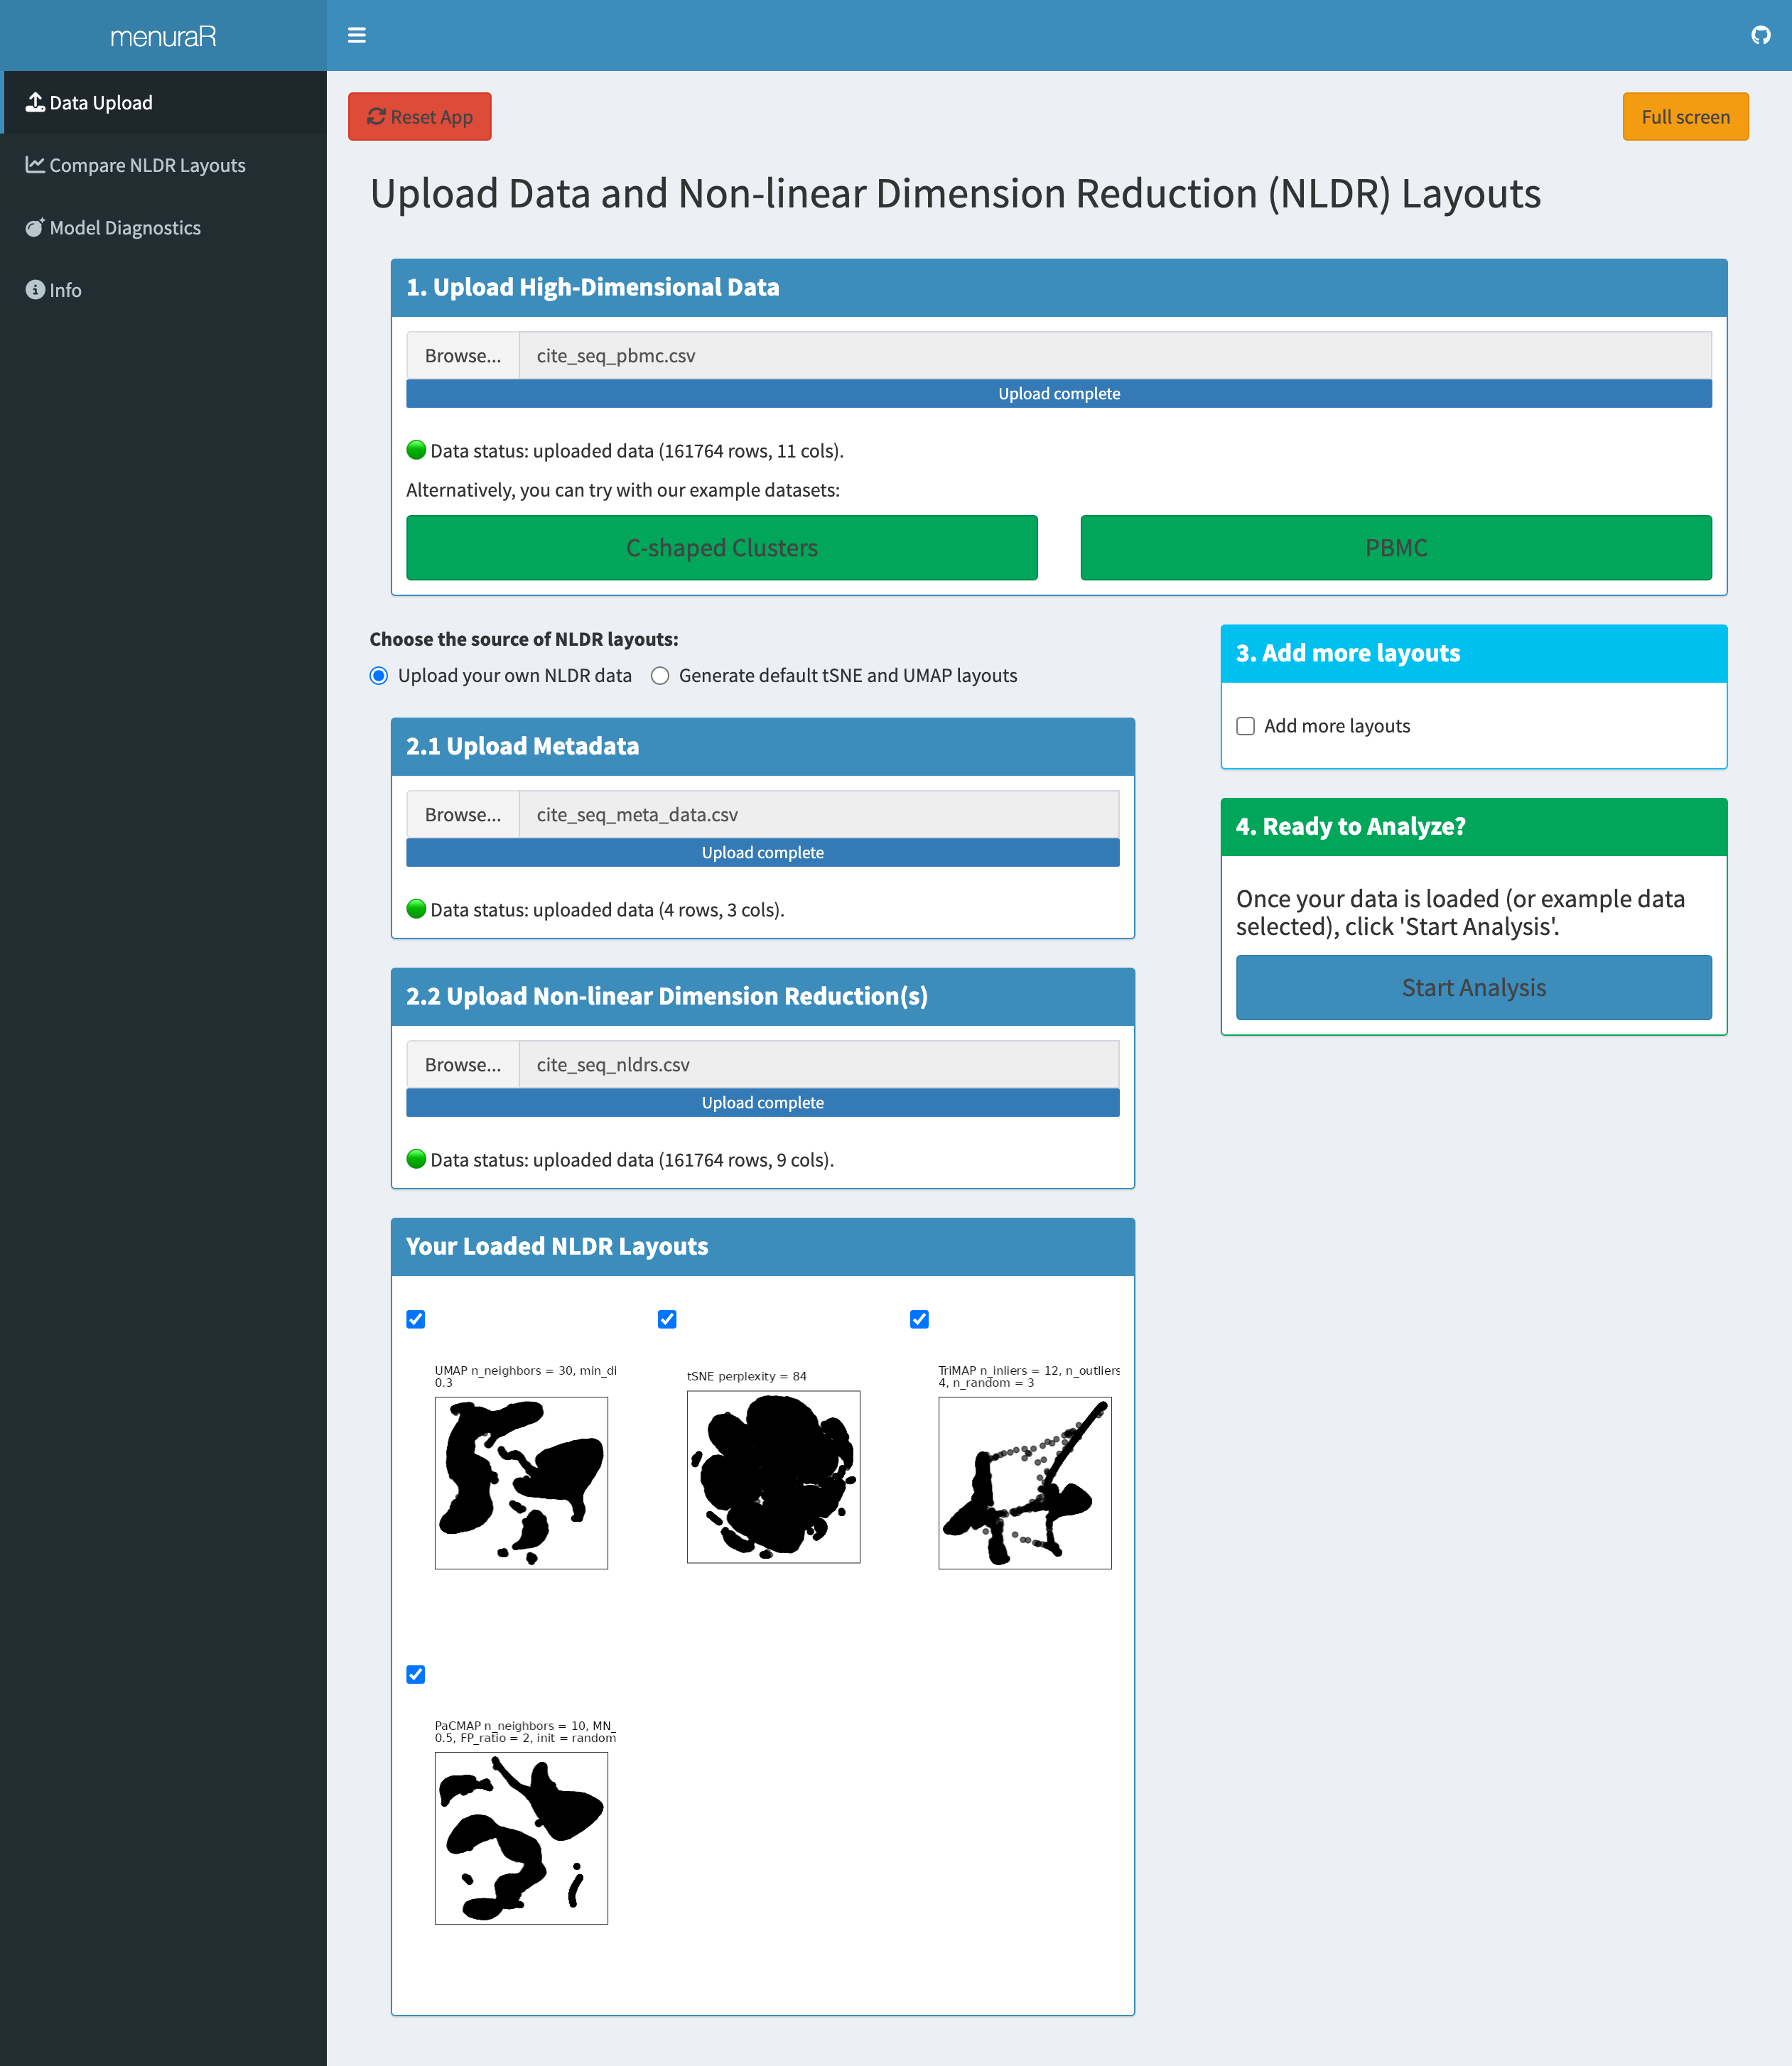
menuraR. The Data Upload tab shows the PBMC CITE-seq dataset together with several precomputed NLDR layouts, including the published UMAP layout and alternative embeddings generated using tSNE, TriMAP, and PaCMAP with different hyper-parameter settings. Uploaded layouts appear in the Your Loaded NLDR Layouts panel.
This allows the layouts to be viewed side by side, overlaid with hexagonal grids, and evaluated using the hexbin error across different bin widths. With menuraR, at a binwidth of 0.03, the most reasonable layout is tSNE with perplexity = 84 (Figure 7.4).
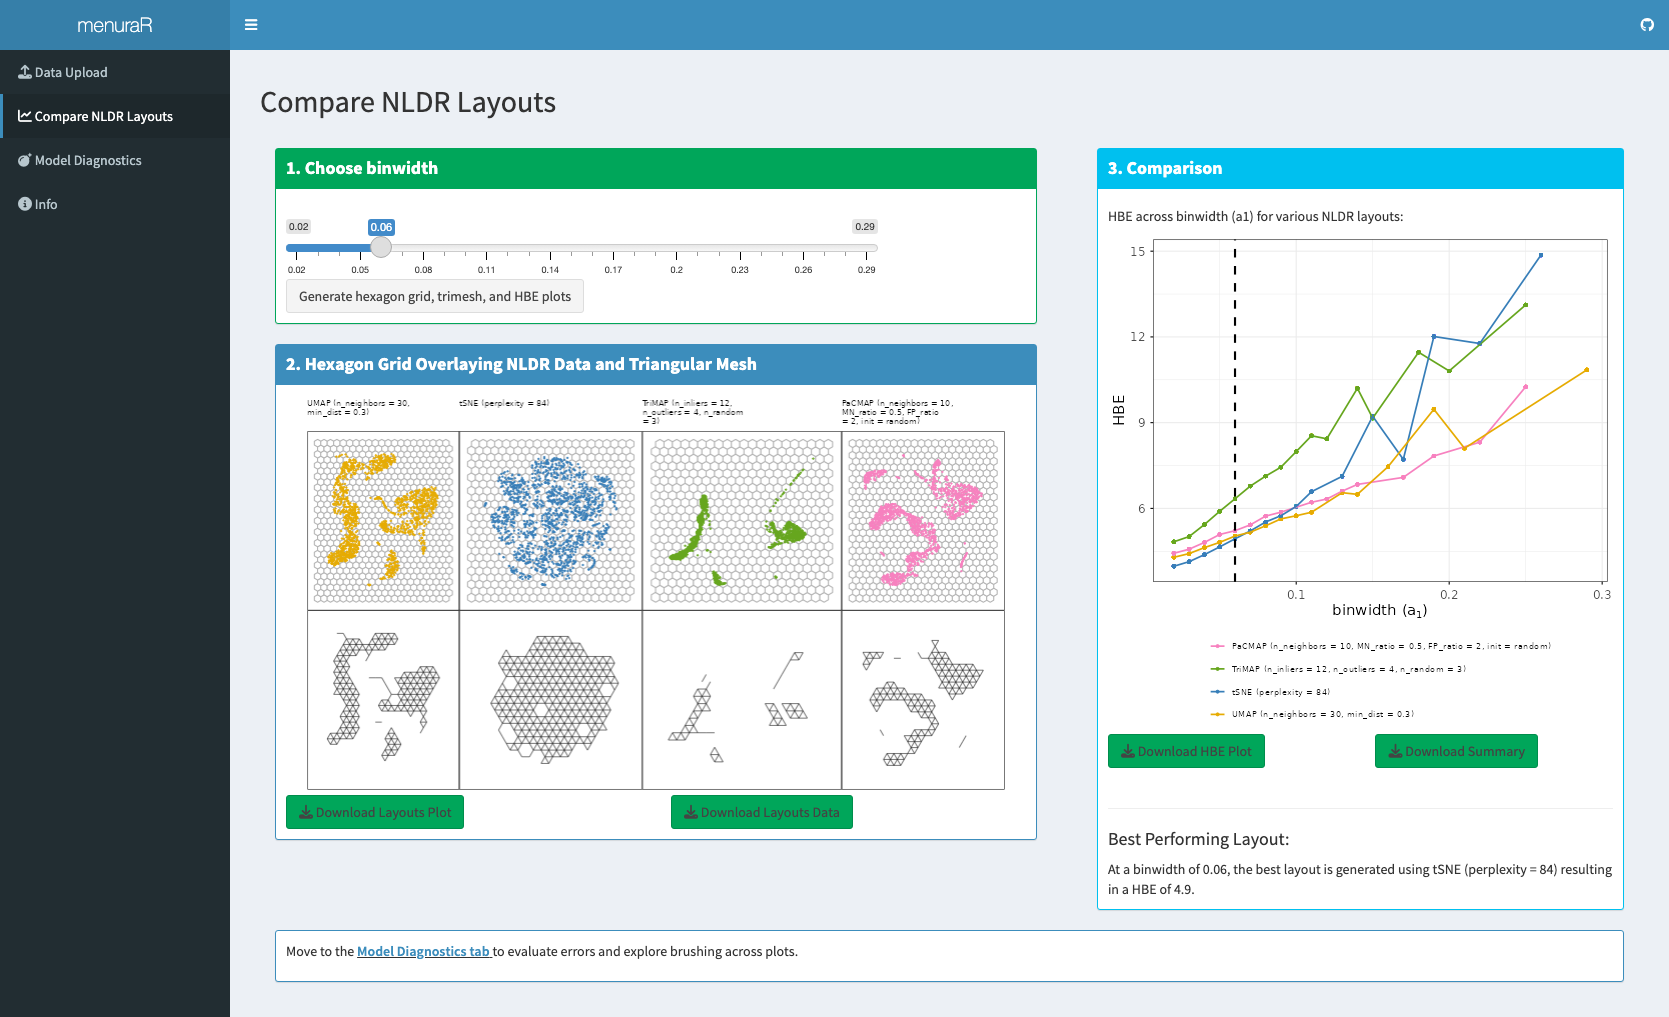
menuraR. The Compare NLDR Layouts tab displays multiple 2\text{-}D NLDR embeddings side by side, overlaid with hexagonal grids and corresponding wireframe representations. Users can explore how the hexbin error (HBE) changes with the binwidth parameter (a_1) and compare layouts directly. For this example, at a binwidth of 0.03, the tSNE layout with perplexity = 84 is identified as the most reasonable representation. Layouts, HBE plots, and summary tables can be downloaded for further analysis.
The TriMAP layout is universally poor. The tSNE layout with little separation performs well at tiny binwidth (where most points are in their own bin) and poorly as binwidth increases. Also, the layout shows more clusters than it should. Both UMAP and PaCMAP perform better in this case because they produce more clearly separated clusters. However, PaCMAP spreads the Gaussian clusters too far apart, with some clusters even overlapping, which makes the structure harder to interpret. In contrast, UMAP provides well-separated clusters without introducing these issues, making it the most reasonable choice here. This addresses the question posed in the Introduction: while NLDR layouts can distort structure in general, the published UMAP layout provides a faithful and visually reasonable representation of the PBMC CITE-seq dataset.
To better understand how these structures can be represented, we generated a synthetic 10\text{-}D dataset using the cardinalR package (Figure 7.5). The dataset contains six clusters with 500, 700, 700, 500, 700, and 700 points, respectively, for a total of 3,800 points. Cluster centers were positioned according to a custom distance matrix to control their relative arrangement, and each cluster was assigned a distinct geometric shape: three approximately Gaussian clusters, one quadratic cluster, one spherical spiral, and one conic spiral, with additional background noise. This synthetic dataset provides a controlled benchmark for assessing how well NLDR layouts capture cluster structure.
cardinalR. To create a synthetic dataset comparable to the 10\text{-}D PBMC CITE-seq data, cardinalR first generated a 4\text{-}D structure consisting of three Gaussian clusters, one quadratic cluster, one spherical spiral, and one conic spiral, with added background noise. Six additional noise dimensions were then included to produce a 10\text{-}D dataset retaining similar structural characteristics.
7.3 Future work
This thesis opens up several directions for future work that build directly on its methodological, experimental, and software contributions. These include extending the proposed methods beyond 2\text{-}D NLDR representations, exploring additional factors that influence how NLDR layouts are perceived, and developing more interactive and diagnostic tools to support evaluation. These directions aim to deepen our understanding of NLDR behavior and improve how these methods are assessed and used in practice.
Extending our algorithm to NLDR representations beyond 2\text{-}D
A potential direction for future work is extending the current algorithm to NLDR results that project into more than two dimensions. While most existing tools, including those developed in this thesis, focus on 2\text{-}D embeddings, exploring projections into higher dimensions like 3\text{-}D or 5\text{-}D spaces could provide richer structural information in some settings.
Binning into cubes (3\text{-}D or higher) could be performed relatively easily and used as the basis for constructing a wireframe representation of the fitted model. The algorithm for convex hull computation in p-dimensions, as described by Barber et al. (1996) and implemented in related software (Laurent 2023), serves as inspiration for this approach. Alternatively, a simpler method using k-means clustering to obtain centroids in higher-dimensional embeddings might be feasible; however, the challenge would lie in determining how to connect these centroids to form an appropriate wireframe structure.
Scagnostics to evaluate NLDR
One promising direction for future work is the integration of scagnostics (Dang and Wilkinson 2014; Wilkinson and Wills 2008) as an additional tool for evaluating NLDR results. Scagnostics provide a set of quantitative shape-based metrics (e.g., convexity, skewness, stringiness, clumpiness) that describe the geometric characteristics of scatterplots. By applying these metrics to 2\text{-}D scatterplots generated by NLDR methods, we could obtain an objective assessment of how well these methods preserve or distort data structures, particularly in relation to their characteristics (eg: nonlinearity).
Moreover, investigating how scagnostic profiles vary with different sample sizes for specific underlying data structures would provide valuable insight into the stability and robustness of NLDR methods. This could help identify which methods are more resilient to changes in sample size and which structures are more prone to distortion under small sample sizes.
Compare prediction approaches
Future work includes evaluating and comparing the prediction capabilities of different NLDR methods. Only some methods, such as UMAP, provide built-in functionality (Konopka 2023) to project new high-dimensional observations into an existing low-dimensional embedding. Our approach introduces a general prediction framework that can be applied to any NLDR method. It works by identifying the nearest high-dimensional bin centroid for a new observation and assigning its corresponding 2\text{-}D centroid from the fitted model.
Having predictions from both the built-in functions (when available) and our centroid-based method allows for direct performance comparisons. This enables a systematic evaluation of how well different approaches preserve structure when projecting new observations into an existing NLDR space.
Interactive diagnostic tool for NLDR evaluation
A promising direction for future work is to extend the interactive capabilities developed in this thesis into a more comprehensive diagnostic tool for evaluating NLDR methods, particularly in the context of clustering. In this work, we have already demonstrated the value of interactive visualization through tours, linked views, and brushing for understanding how different NLDR layouts align with structure in the original high-dimensional data. Building on these ideas, a natural next step is the development of an interactive diagnostic tool that supports more targeted exploration of where and why NLDR methods succeed or fail.
This functionality could be developed as an extension of the existing menuraR Shiny application, which already provides a framework for exploring NLDR layouts alongside high-dimensional structure. The proposed tool would allow users to upload 2\text{-}D embeddings, high-dimensional data or distance matrices, and results from spin-and-brush analysis (Cook et al. 2000; Wilhelm et al. 1999), enabling deeper inspection of discrepancies between representations.
Spin-and-brush is a dynamic visual method for exploring clustering structure in high-dimensional numerical data and has proven effective for identifying the influence of nuisance variables, differences in cluster shape or variance, and the presence of low-dimensional manifolds. Support for recording and replaying brushing sequences, as implemented in the detourr package (Hart and Wang 2025), aligns closely with the interactive strategies used throughout this thesis and would integrate naturally into the proposed diagnostic workflow.
The envisioned interface would build on linked-view concepts already explored here. For example, users could select a cluster and a specific data point within a 2\text{-}D NLDR layout and examine how that point relates to others in the same cluster through linked distance-based views. One panel could display the selected cluster and point in the embedding, while a second panel shows the distribution of high-dimensional distances from that point to other cluster members.
Linked brushing between these panels would allow users to directly investigate where NLDR methods preserve local and global structure and where distortions occur. By extending the interactive ideas developed in this thesis, such a tool would support more intuitive diagnosis of NLDR performance and provide a foundation for developing automated evaluation measures that are better aligned with human interpretation.
Visualizing experimental designs
An important practical challenge encountered throughout this thesis is understanding, validating, and diagnosing results from complex experimental designs involving multiple factors and conditions. To support this process, a useful direction for future work is the development of an interactive visualization tool specifically designed to explore and validate experimental designs and their outcomes, including those used in the perceptual studies presented in this thesis.
The main objective of this tool is to visualize and validate experimental results. It includes a web application that allows users to upload experimental design data and corresponding results for visualization. Interactive features such as linked selections and filtering would support exploration of relationships between factors and responses. While the tool primarily targets categorical experimental factors, continuous variables could be transformed into intervals to enable consistent visualization.
The proposed workflow includes importing experimental design and results data, preprocessing, 2\text{-}D static visualization, 2\text{-}D interactive visualization, and dynamic visualization. Preprocessing steps involve mapping design variables, identifying missing responses, transforming data to wide format to compute response counts for each factor-level combination (with missing combinations recorded as 0), and converting the data into a long format suitable for visualization. Static plots created using ggplot2 (Wickham 2016) provide an overview of response distributions across factor levels, while plotly (Sievert 2020) adds interactivity through hover-based detail. Dynamic visualizations represent each factor-level combination as a vertex, with jittered points indicating response counts and edges connecting combinations that differ by a single factor level. This functionality is currently supported through the detourr package (Hart and Wang 2025).
Investigating perception and misperception in NLDR with additional factors
One of the contributions of this thesis is the development of a controlled experimental framework for studying how people perceive and interpret NLDR layouts. With this framework in place and shown to work well for measuring perceptual accuracy and misperception, many additional experimental questions can now be explored systematically.
While the current user study focused primarily on how cluster separation influences human perception of NLDR layouts, many additional factors are likely to affect how users conceptualize and interpret low-dimensional embeddings. An important direction for future work is therefore to extend this experimental paradigm to investigate how variations in data characteristics and algorithmic choices influence perception and misperception.
Specifically, we propose extending the perceptual study to consider:
Background noise: Adding uniformly or normally distributed noise to the data can obscure true structure, and it is important to understand how different NLDR methods handle such interference and how users respond to it visually.
Number of clusters: As the number of clusters increases, distinguishing them in 2\text{-}D may become more challenging, particularly if the separation is subtle or overlaps occur.
Noise dimensions: Including additional high-dimensional features that contain no signal (i.e., noise variables) can affect NLDR outcomes. We aim to evaluate how this impacts perceived structure.
Sample size: Varying the number of observations may change both the visual density and the stability of the NLDR projection, influencing the interpretability of patterns.
Random seed: Since many NLDR methods are stochastic (e.g., tSNE, UMAP), different seeds can lead to different embeddings. It is valuable to understand whether these differences are perceptible to users and how they affect interpretability.
NLDR hyper-parameters: Algorithm-specific hyper-parameters (such as perplexity in tSNE or the number of neighbors and minimum distance in UMAP) have a strong influence on the resulting embedding. By systematically varying these settings within the experimental framework developed in this thesis, future studies could examine how hyper-parameter choices change the visual appearance of layouts and whether these changes are noticeable or misleading to users.
By extending the study to incorporate these data-driven variables, we can build a more comprehensive understanding of when and why human misperception occurs in NLDR layouts, and which methods are more resilient to such distortions. This work will support the development of more robust diagnostics and improve the practical use of NLDR.
Lineup protocols to evaluate NLDR sensitivity and structure preservation
In this thesis, particularly in Chapter 5, we developed and applied a controlled experimental framework to study how people judge whether a static 2\text{-}D NLDR layout represents the same underlying high-dimensional data as a tour of linear projections. This task enabled us to quantify perceptual accuracy and misperception, and to examine how these outcomes depend on factors such as cluster separation and the choice of NLDR method.
As discussed in the previous section, this framework can be extended by introducing additional data- and algorithm-related factors that may influence perception. A complementary direction is to modify the experimental task itself, with the goal of probing different aspects of how NLDR layouts are perceived and potentially increasing statistical power. One promising approach in this regard is the use of lineup-based evaluation protocols (Buja et al. 2009).
Lineups were originally introduced as a graphical inference tool for assessing whether visual structure in a plot is stronger than what would be expected under a null model. In a lineup, a plot generated from the true data is randomly embedded among a set of null plots, and observers are asked to identify the plot that appears most different. Successful identification provides evidence that the visual structure is perceptually salient and not attributable to chance.
When combined with the experimental framework developed in this thesis, lineups could be used to evaluate how well a 2\text{-}D NLDR layout preserves structure from the original high-dimensional data. For example, a lineup could include one NLDR layout computed from the true data alongside several null layouts generated from shuffled data or noise-perturbed versions. If participants consistently identify the true layout, this would suggest that the NLDR method preserves meaningful structure in a way that is perceptually accessible to human viewers.
Lineups could also be used to study the sensitivity of NLDR methods to hyper-parameter choices. Layouts generated under different hyper-parameter settings such as perplexity in tSNE or the number of neighbors and minimum distance in UMAP could be embedded within a lineup to assess whether small parameter changes lead to perceptually distinguishable differences. This would allow the robustness and stability of NLDR methods to be evaluated from a human-centered perspective and could help guide more reliable parameter selection.
Comparative perceptual study of PCA and NLDR methods
Another valuable direction for future work is to investigate how PCA compares to NLDR methods in terms of human perception and interpretability. PCA is a linear method widely used for its simplicity and mathematical transparency, whereas NLDR methods often involve nonlinear transformations and hyper-parameter tuning.
By comparing how users interpret and misinterpret PCA layouts versus NLDR-generated layouts, we can gain insights into whether linear techniques are inherently easier to understand or whether they may lead to different types of visual distortions. This work would help clarify when PCA is sufficient for visual analysis and when the added complexity of NLDR is warranted, particularly for exploratory tasks that rely on visual intuition.
Extension for quollr
A useful extension to quollr would be to link cluster selections between the tour view and the 2\text{-}D NLDR layout. This would let users select a cluster in one view and immediately see how it appears in the other, making it easier to compare cluster structure across views.