Nonlinear dimension reduction (NLDR) methods such as tSNE and UMAP are widely used to visualize high-dimensional biological data, including single-cell RNA-seq and genomics datasets in two dimensions. However, choosing an appropriate method and tuning hyper-parameters typically requires iterative experimentation and expert knowledge. Existing tools offer limited support for systematically comparing multiple NLDR layouts or diagnosing how well each layout reflects the underlying high-dimensional structure. We present menuraR, an interactive Shiny web application for evaluating and comparing multiple NLDR layouts quantitatively and qualitatively. Built on the quollr package, menuraR provides a graphical user interface for generating, visualizing, and diagnosing NLDR representations without programming. Users can compare multiple layouts, assess representation using the hexbin error (HBE), and view the model fitted in high dimensions. Linked brushing helps to investigate where the NLDR model has challenges representing the high-dimensional data. An example workflow using a PBMC single-cell dataset demonstrates how menuraR supports more informed, transparent, and reproducible analysis of high-dimensional biological data.
Introduction
Nonlinear dimension reduction (NLDR) methods such as tSNE (Maaten and Hinton 2008) and UMAP (McInnes et al. 2018) have become essential tools for exploring and visualizing high-dimensional data across diverse scientific disciplines. These techniques enable researchers to uncover structures, clusters, and patterns that are not immediately visible in the original feature space. However, the flexibility and power of these methods come with challenges: the quality and interpretability of low-dimensional embeddings are often highly sensitive to hyper-parameter choices, random initialization, and characteristics of the underlying data. As a result, identifying the most meaningful and faithful representation typically requires iterative experimentation, systematic evaluation, and domain expertise.
To address these challenges, we introduce menuraR (monitoring embeddings of nonlinear unfoldings for representation and analysis in R), an interactive Shiny application created to facilitate the evaluation of NLDR layouts. Building on the functionality of the quollr package (Gamage et al. 2025a), menuraR provides a graphical user interface that enables users to compare multiple NLDR layouts, explore the effects of different hyper-parameter settings, and apply diagnostic tools for evaluating NLDR layout(s). The quollr package is useful for understanding how NLDR warps high-dimensional space and fits the data. Starting from a two-dimensional NLDR layout, quollr constructs a wireframe representation that is lifted back into the high dimensions (see Gamage et al. (2025b) for algorithmic details) and viewed using a tour (Asimov (1985), a continuous sequence of linear projections). This model-based view helps reveal how NLDR methods warp high-dimensional geometry, where the embedding fits the data well, and where distortions or mismatches occur.
These capabilities are delivered through an intuitive interface that eliminates the need for programming, thereby lowering the technical barrier for users.
A key advantage of menuraR is its accessibility. The application is fully web-based and does not require a local installation of R or package management. Centralized hosting ensures that users always access the most up-to-date version, while reproducibility is supported through logging and open availability of the underlying code. In this way, menuraR enhances transparency in NLDR evaluation and fosters broader adoption of rigorous visualization practices.
This chapter introduces menuraR, describing its implementation, core features, and intended use cases. We demonstrate how the application can inform NLDR choices, highlight key visual diagnostics, and support exploratory data analysis and teaching.
Methods
The menuraR application is implemented in R using the shiny package (Chang et al. 2025), which provides the reactive framework required for interactive web applications. Supporting packages, including shinycssloaders (Attali and Sali 2024), are used to indicate progress during computationally intensive tasks.
The application enables users to generate and compare two-dimensional NLDR layouts in high-dimensional space. Users can either upload their own pre-computed NLDR layouts or compute layouts using tSNE (Krijthe 2015) and UMAP (Melville 2025) as part of the application. Core computations, including layout generation, model fitting, and diagnostic evaluation, are handled by the quollr package (Gamage et al. 2025a). This includes construction of two-dimensional wireframe representations, lifting these structures into the original high-dimensional space, and computing the hexbin error (HBE) across a range of binwidths.
menuraR is deployed on the shinyapps.io (RStudio, PBC n.d.) platform, allowing users to access the application through a web browser without local installation or dependency management. This provides a consistent environment for users within a given deployment, while long-term reproducibility is supported through version-controlled code and documented workflows.
The combination of an interactive Shiny interface with the quollr back end allows users to explore multiple embeddings, assess hyper-parameter effects, and examine diagnostic measures within a single workflow, without requiring programming expertise.
The Shiny application
The menuraR app contains three main tabs: (1) Data Upload, (2) Compare NLDR Layouts, and (3) Model diagnostics. Each tab includes numbered steps and clear instructions that guide users from data input to interpretation of results.
Data upload
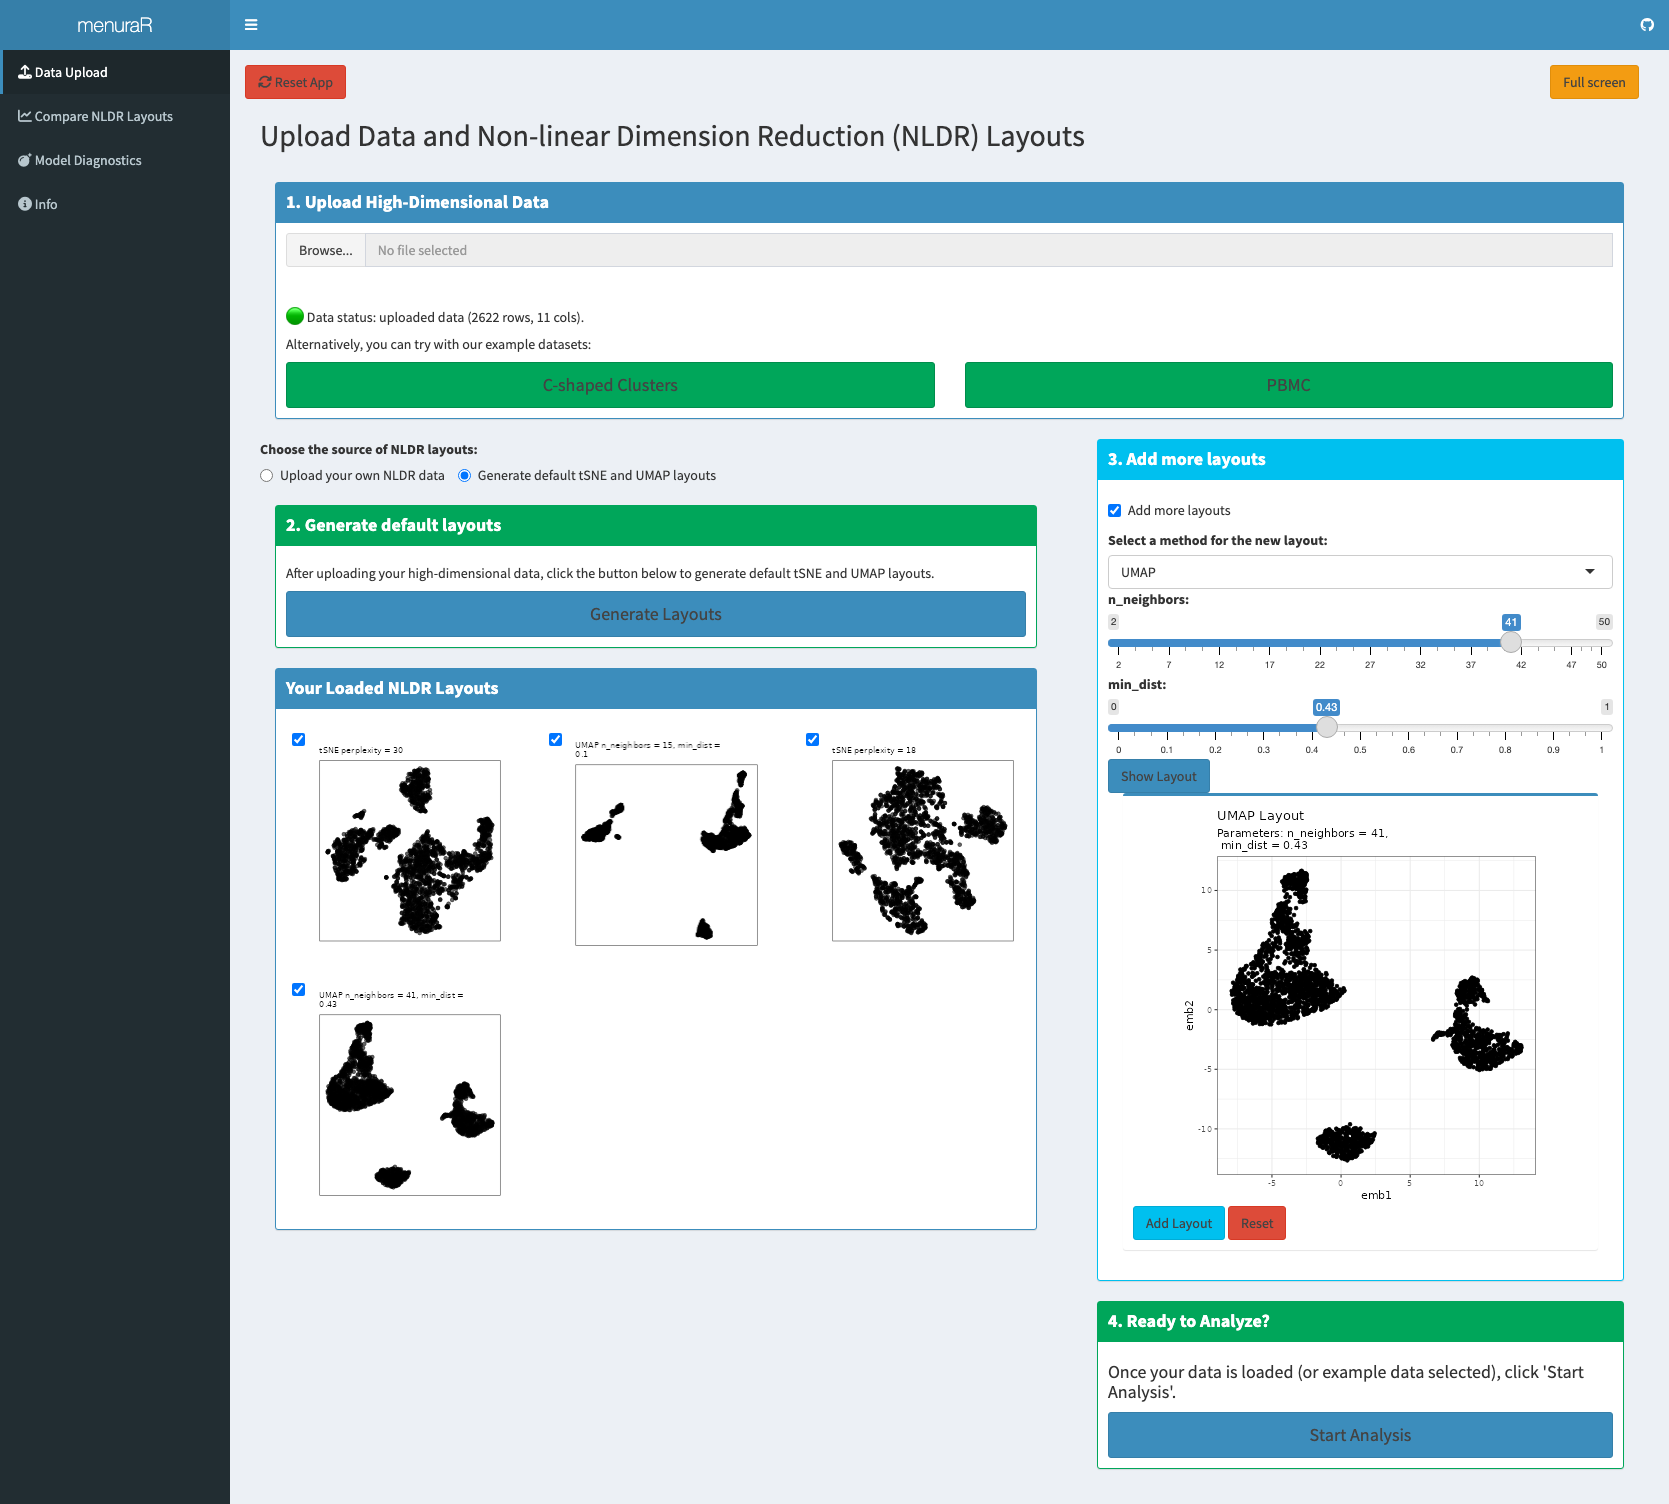
Analysis in menuraR begins in two ways: by uploading user-provided high-dimensional data or by using one of the built-in example datasets (Figure 7.3). Two datasets are provided within the application: C-shaped Clusters, a synthetic dataset illustrating nonlinear structure, and PBMC, a biological single-cell dataset for real-world exploration (Satija et al. 2025). If the user uploads their own high-dimensional data, the file should be a CSV and the CSV must have a unique ID column, with data columns prefixed by the letter x (e.g., x1, x2, etc.).
Once the high-dimensional data is uploaded, under “Choose the source of NLDR layouts”, users select an NLDR layout source: “Upload your own NLDR data”, or “Generate default tSNE and UMAP layouts”. Selecting “Upload your own NLDR data” activates the uploaded NLDR layouts and metadata for comparison. Precomputed NLDR layouts are uploaded as a CSV file. For each layout, the two embedding dimensions are labeled emb1 and emb2. If multiple layouts are included, embedding columns are prefixed with the layout number (e.g., 1_emb1, 1_emb2). Also, the metadata CSV file includes the NLDR layout name (e.g., 1, 2, etc.), the method used (like UMAP or tSNE), and any hyper-parameters formatted with the parameter name followed by its value, separated by a dash (e.g., perplexity-30 for tSNE). All uploaded files must be under 100 MB in size, and it is essential that each dataset follows the variable naming conventions required by the web application. Alternatively, users may choose “Generate default tSNE and UMAP layouts”, in which case the application automatically computes two embeddings using default hyper-parameter settings for tSNE and UMAP.
Once loaded, all available NLDR layouts appear in the “Your Loaded NLDR Layouts” box. Users can select or deselect specific layouts to include in the comparison.
Adding additional layouts
The application also allows users to generate additional layouts directly within the interface. Users select the NLDR method (tSNE or UMAP), specify hyper-parameters, and click “Show Layout” to generate the embedding. If satisfied, they can add it to the comparison using “Add Layout”; otherwise, they may adjust the parameters and regenerate the layout. Multiple additional layouts can be created and compared in this manner.
Once the desired layouts are finalized, users click “Start Analysis” to proceed automatically to the next tab, Compare NLDR Layouts, where the evaluation and comparison of embeddings take place.
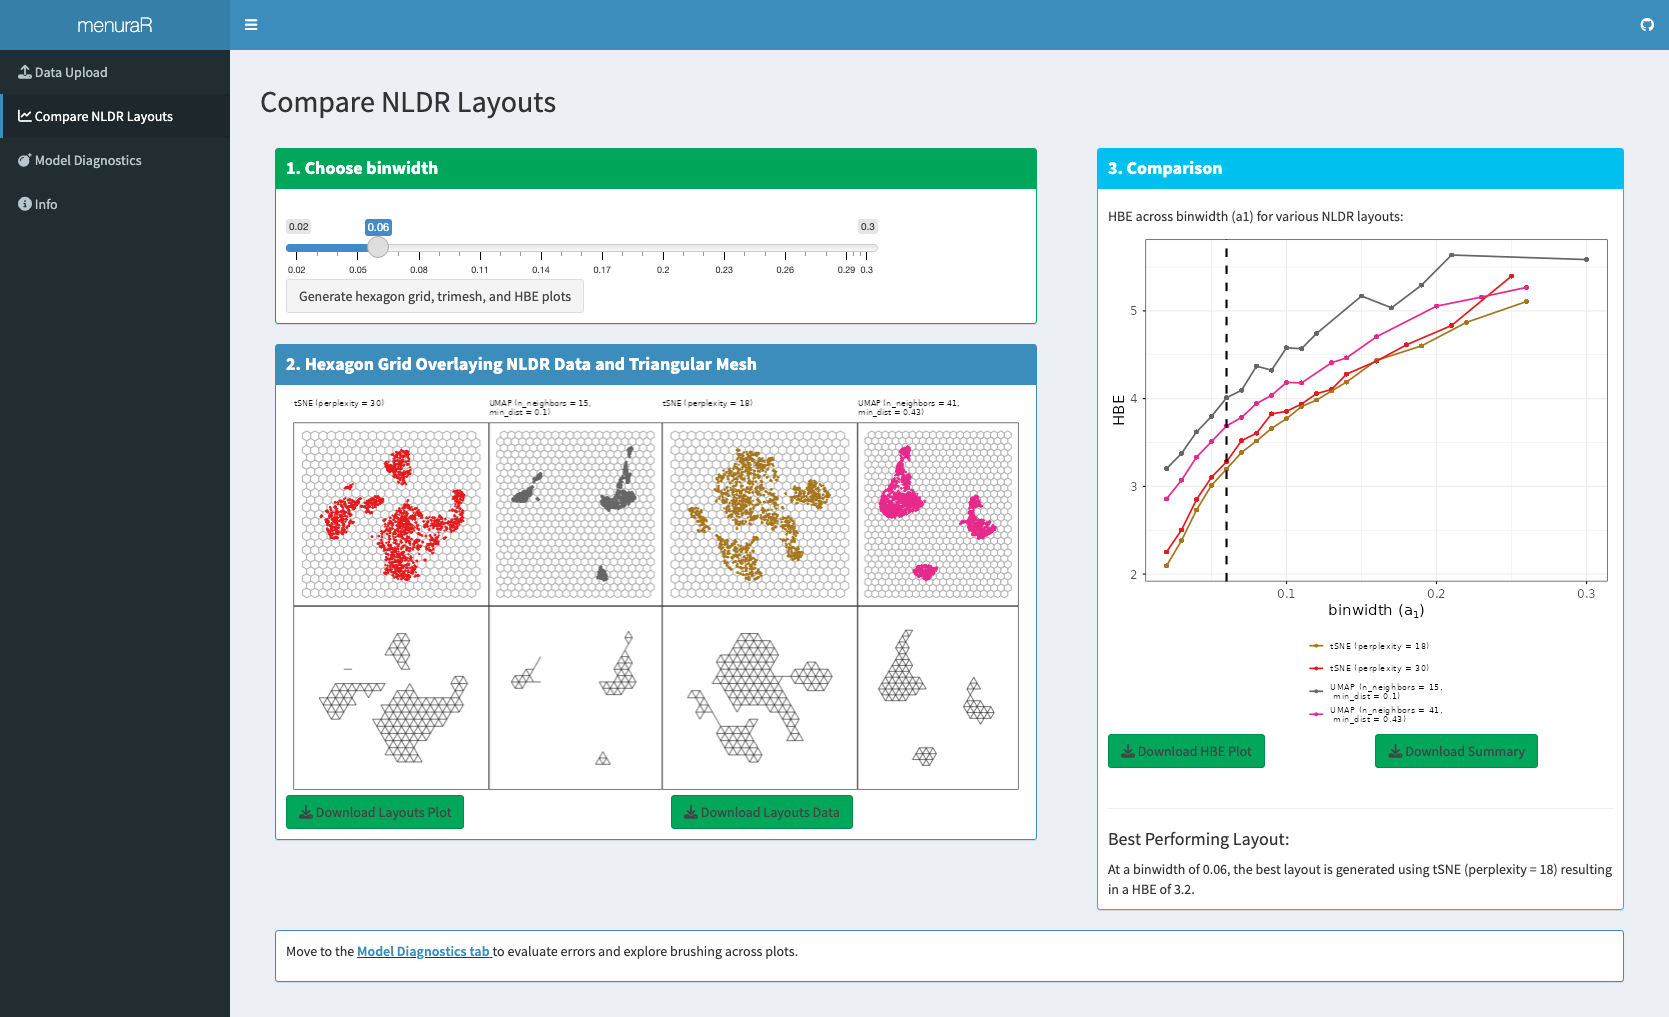
Compare NLDR Layouts
The comparison begins by selecting the binwidth (a_1), which controls the width of the hexagons in the hexagonal grid (Figure 7.4). For the chosen binwidth, a_1, the Shiny application visualizes hexagonal grids overlaid on each selected 2\text{-}D NLDR layout. Also, the app constructs a 2\text{-}D wireframe representation for each layout, which forms the basis for subsequently lifting the model into high-dimensional space. The app also generates a plot showing the Hexbin Error (HBE) against the binwidth parameter (a_1) and identifies the “best” representation that yields the lowest HBE for that specific a_1. Users can modify the a_1 value to see what layout performs best for the chosen bandwidth.
Furthermore, users have the option to download the 2\text{-}D layouts, corresponding data, the HBE versus binwidth plot, and the summary table, which contains error, HBE, the number of bins along the x-axis (b_1), the number of bins along the y-axis (b_2), the total number of bins (b), the number of non-empty bins (m), the binwidth (a_1), the bin height (a_2), standardized bin counts (w_h), and NLDR method id.
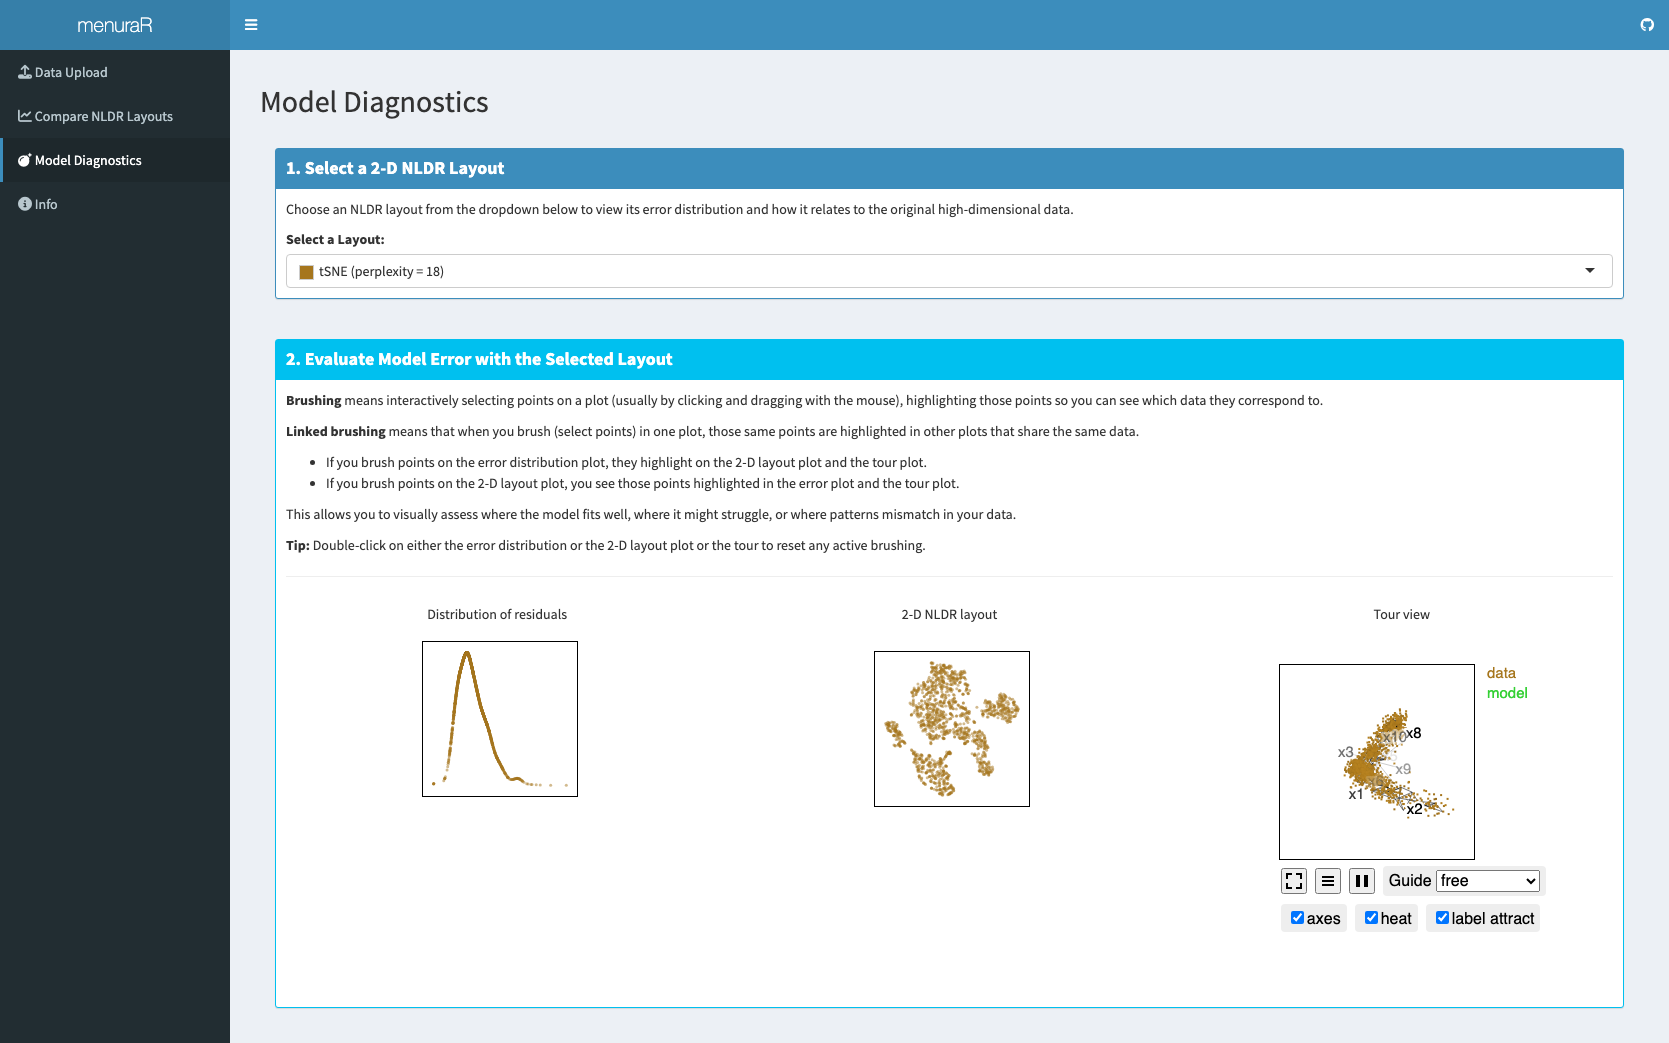
Model diagnostics
Once the best representation is selected, interactive plots are generated to display the high-dimensional model error, the best 2\text{-}D layout, and a tour view of the model overlaying the high-dimensional data (Figure 6.3). This interactivity allows users to identify where the model fits well, where it is better in some areas, and where it fails to match the data. Importantly, model diagnostics are not limited to the best NLDR layout; other layouts can also be selected and examined for comparison.
Example workflow
We evaluated menuraR using the PBMC3k single-cell RNA-seq dataset (Satija et al. 2025), a widely used benchmark for assessing dimension reduction methods in single-cell analysis. This dataset contains 2622 human peripheral blood mononuclear cells (PBMCs) measured across 1000 gene expression variables and is commonly used to study cellular heterogeneity and population structure at the single-cell level.
In single-cell RNA-seq analysis, clustering is typically used to identify groups of cells with similar expression profiles, while nonlinear dimension reduction (NLDR) methods are employed to summarize and visualize this structure in two dimensions. Importantly, NLDR methods do not use cluster labels to compute embeddings; labels are instead used post hoc for interpretation and visualization.
We applied NLDR methods to the first nine principal components of the gene expression matrix. Using the Compare NLDR Layouts tab of menuraR, we generated four embeddings commonly used in practice: tSNE with perplexity values of 30 (default) and 18, and UMAP with ({\text{n\_neighbors}}, \text{min\_dist}) set to (15, 0.1) (default) and (41, 0.43). Visual comparison showed consistent separation of major immune cell populations across all layouts, with clear differences in cluster separation and neighborhood continuity. Overall, tSNE produced smaller inter-cluster separation, while UMAP yielded more distinct clusters. For both methods, hyper-parameter choices controlled the local–global trade-off: smaller neighborhood sizes or lower perplexity emphasized tight local groupings, whereas larger neighborhood sizes or higher perplexity produced smoother global transitions (Figure 7.4).
The Comparison panel enabled a quantitative comparison of these layouts using the hexbin error (HBE). At a binwidth of a_1 = 0.06, the tSNE layout with \text{perplexity} = 18 achieved the lowest HBE, indicating the best agreement between the two-dimensional embedding and the fitted high-dimensional model at this binwidth.
Linked brushing in the Model Diagnostics tab showed that the model fits the data well and highlighted filled-out and dense clusters that are not visible from the NLDR layout (Figure 6.3).
Conclusions
This chapter introduces menuraR, a web-based interface designed to assist in the evaluation and selection of the most reasonable NLDR layout(s). Although NLDR methods such as tSNE and UMAP are widely used for visualizing high-dimensional data, interpreting and selecting the most representative layout can be complex. The menuraR application addresses this challenge by providing an accessible, intuitive, and interactive environment that encapsulates the diagnostic features of the quollr package, making NLDR selection feasible for users with varying levels of technical expertise.
Developed using the R Shiny framework, menuraR eliminates many of the technical barriers traditionally associated with advanced statistical software. Users do not need to install additional packages or configure language-specific environments, which is particularly valuable for interdisciplinary research teams and educational settings. The platform helps users to compare NLDR layouts, select the ones that most accurately represent the high-dimensional data structure, and assess NLDR results.
Currently, menuraR supports only two NLDR methods: tSNE and UMAP for computing additional layouts within the app. Performance may vary depending on dataset size and browser memory limits, as all computations are handled server-side. Users working with very large datasets may experience slower response times, and expanding support to other NLDR methods is a potential direction for future development.
Acknowledgments
We thank members of NUMBATs, the working group of the Department of Econometrics and Business Statistics, Monash University, Australia, for their participation in the usability survey and for providing valuable feedback that helped improve this research.
Asimov, D. (1985),
“The Grand Tour: A Tool for Viewing Multidimensional Data,” SIAM Journal of Scientific and Statistical Computing, 6, 128–143.
https://doi.org/10.1137/0906011.
Chang, W., Cheng, J., Allaire, J., Sievert, C., Schloerke, B., Xie, Y., Allen, J., McPherson, J., Dipert, A., and Borges, B. (2025),
shiny: Web Application Framework for R, R package version 1.11.1.
Gamage, J. P., Cook, D., Harrison, P., Lydeamore, M., and Talagala, T. S. (2025b),
“Choosing Better NLDR Layouts by Evaluating the Model in the High-dimensional Data Space,” arXiv preprint, arXiv:2506.22051.
Gamage, J. P., Cook, D., Harrison, P., Lydeamore, M., and Talagala, T. S. (2025a),
“quollr: An R Package for Visualizing 2-D Models from Nonlinear Dimension Reductions in High-Dimensional Space,” arXiv preprint, arXiv:2512.18166.
Maaten, L. V. D., and Hinton, G. E. (2008),
“Visualizing Data Using t-SNE,” Journal of Machine Learning Research, 9, 2579–2605.
McInnes, L., Healy, J., Saul, N., and Großberger, L. (2018),
“UMAP: Uniform Manifold Approximation and Projection,” Journal of Open Source Software, 3, 861.
Melville, J. (2025),
snedata: SNE Simulation Dataset Functions, R package version 0.0.0.9001.
Satija, R., Hoffman, P., and Butler, A. (2025),
SeuratData: Install and Manage Seurat Datasets, R package version 0.2.2.9002.