1 Introduction
A high-dimensional dataset is one in which each observation is described by many features, or dimensions, often with associations among them. To create visual representations of high-dimensional data, it is common to apply dimension reduction techniques. One established approach is linear projection, where high-dimensional points are represented as linear combinations of the original features. Principal Component Analysis (PCA) (for an overview, see Jolliffe (2011)) is the most familiar method, identifying directions of maximum variance. Extending this idea, tours (See Lee et al. (2021) for a review of tour methods) provide dynamic sequences of linear projections, giving views from multiple angles to help reveal hidden structure. Tour methods are implemented in R packages such as tourr (Wickham et al. 2011), langevitour (Harrison 2023), and detourr (Hart and Wang 2025). A key advantage of linear projections is that they preserve the geometric relationships of the original data; they do not introduce distortion. However, linear projections can become cluttered, and global structure may obscure local detail. Furthermore, piling (Laa et al. 2022), where points concentrate in the center of projections, can mask important variation.
Because linear projections can reveal only limited aspects of high-dimensional structure, analysts often turn to nonlinear dimension reduction (NLDR) methods in the hope of revealing patterns that may not be visible in any linear view. Common NLDR techniques include t-distributed stochastic neighbor embedding (tSNE) (Maaten and Hinton 2008), uniform manifold approximation and projection (UMAP) (McInnes et al. 2018), potential of heat-diffusion for affinity-based trajectory embedding (PHATE) (Moon et al. 2019), large-scale dimensionality reduction using triplets (TriMAP) (Amid and Warmuth 2022), and pairwise controlled manifold approximation (PaCMAP) (Wang et al. 2021). The methods tSNE, UMAP, TriMAP, and PaCMAP can be considered for producing the 2\text{-}D representation by minimizing the divergence between two inter-point distance distributions. PHATE is an example of a diffusion process spreading to capture geometric shapes that include both global and local structure. (See Coifman et al. (2005) for an explanation of diffusion processes.) These methods are designed to exaggerate structure, making it easier for analysts to detect patterns that may not be apparent through linear projections.
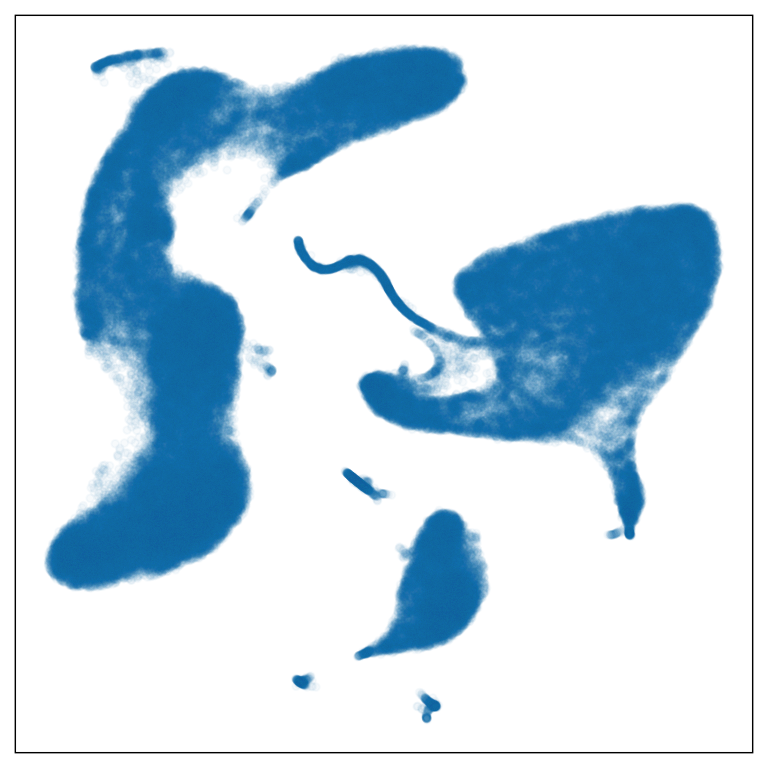
Yet this strength also introduces a critical risk: NLDR can hallucinate structure, creating patterns in the low-dimensional space that do not exist in the high-dimensional data. This is illustrated in Figure 1.1, where a UMAP layout of a CITE-seq dataset appears to show several distinct clusters with different shapes. While these patterns are visually appealing and easy to interpret, it is not obvious whether they reflect true structure in the high-dimensional data or arise from the choice of method and hyper-parameters. This naturally leads to key questions: Can this layout be trusted? Does it faithfully represent the structure of the underlying 10\text{-}D PBMC CITE-seq data?
Despite the widespread use of NLDR, there is no widely accepted or visually interpretable framework for diagnosing the reliability of NLDR representations. Analysts are left to rely on subjective judgment when choosing and interpreting NLDR layouts, without tools to distinguish faithful representations from artifacts. There is also a lack of benchmark clustering datasets for testing, especially NLDR methods.
In addition to technical gaps, little is known about how people perceive and misperceive structure in NLDR layouts. It is unclear how different NLDR representations influence analysts’ conclusions, or how distortions introduced by NLDR affect decision-making. Given the critical role of visualization in high-dimensional data analysis, understanding the human perception of NLDR representations is essential.
1.1 Research objectives
This thesis aims to address the key challenges in understanding and evaluating NLDR methods through four main objectives:
Develop a new approach and software to evaluate NLDR techniques, providing tools to assess whether low-dimensional representations accurately capture the high-dimensional data structures, using visual and quantitative diagnostics.
Design and conduct a user study to explore perception and misperception in NLDR representations, assessing whether participants conceptualize the data structure similarly in NLDR layout compared to tours of linear combinations. This will guide the development of further cognitive perception experiments for assessing NLDR.
Generate benchmark clustering data structures in high dimensions with some additional properties like background noise, using the
cardinalRpackage, to evaluate the performance of the algorithms, like clustering, NLDR.Provide a web tool for NLDR users to help select the most reasonable NLDR representation among a selection of possible layouts.
1.2 Contribution
This research contributes to a deeper understanding of how NLDR methods can be evaluated and trusted in practice. It provides new tools and software for assessment, benchmark datasets for testing algorithms, and insights from a user study exploring how participants perceive and misperceive structures in NLDR layouts.
1.3 Thesis outline
The rest of the thesis is organized as follows:
Chapter 2 introduces an algorithm to assess the NLDR and decide on which, if any, is the most reasonable representation of the structure(s) present in high-dimensional data. We create a model starting with an NLDR layout that is then used to display as a wireframe in high dimensions.
Chapter 3 presents the implementation of the work, which is available as an R package named quollr, an acronym for “questioning how a high-dimensional object looks in low-dimensions using r” (Gamage et al. 2025a). This package also contains a function for performing hexagonal binning using a new approach, for saving langevitour results with a specific projection, and link plots to understand the quirks that occur with different NLDR techniques.
Chapter 4 introduces the R package, cardinalR (Gamage et al. 2025b) (collection of various high-dimensional data structures in R), which includes functions to generate high-dimensional clustering data structures, with features such as adding noise dimensions and background noise, along with some already generated examples.
Chapter 5 provides empirical evidence on how viewers recognize structure differently when using NLDR layouts versus the tour view, particularly with varying distances between clusters. The findings will help clarify common mistakes made when selecting and reporting structures based on NLDR layouts.
Chapter 6 introduces menuraR (monitoring embeddings of nonlinear unfoldings for representation and analysis in R), a Shiny web application designed to select and evaluate NLDR layouts.
Chapter 7 concludes the thesis, summarizes the contribution of the work, and discusses some future plans.